
Reggie Middleton is an entrepreneurial investor who guides a small team of independent analysts, engineers & developers to usher in the era of peer-to-peer capital markets.
1-212-300-5600
reggie@veritaseum.com


The day before the SNAP IPO, I penned "Goldman Sachs & Morgan Stanley Pull Off the Heist of the Decade, Bends Over Those Who Don't Read BoomBustBlog". Despite being rather dramatic, I was dead serious. Fastword 48hours after the IPO, and I was able to pen "On Just the 2nd Full Day of Trading, Arithmetic Reality Hits SNAP Stock". Who could've known? Now, four days after the IPO, guess what?
One of my (many) gripes with the SNAP IPO (and to be honest, many others brought this point up as well) was the sale of common stock with absolutely no voting rights, to wit:
Well, Reuters reports activistist investors are attempting to block SNAP from inclusion in major indexes, to wit:
A group representing large institutional investors has approached index providers S&P Dow Jones Indices and MSCI Inc, looking to bar Snap Inc (SNAP.N) and any other company that sells investors non-voting shares from their stock benchmarks.
Both index providers have said they are reviewing Snap's inclusion. Were Snap to be added to indexes such as the S&P 500 Index or the MSCI USA Index, managers of stock index portfolios would have to buy its shares, and other investors whose performance is tracked against such indexes would likely follow suit.
Some money managers worry about buying Snap’s Class A shares because they have no voting rights, meaning those shareholders will have no voice on matters like company strategy or executive pay.
"They're tapping public markets but giving public shareholders no say," said Amy Borrus, deputy director of the Council of Institutional Investors, which represents pension funds and other large asset owners, in an interview.
In reaching out to both index providers, she said, "What we would like to see at the least is for the indexes to exclude new no-vote companies."
David Blitzer, managing director of S&P Dow Jones Indices and chair of a committee overseeing its indexes, said they would not add a new stock like Snap for six to 12 months after its IPO in any case, and will use that time to study Snap's structure.
While the index provider does not have a hard requirement about a company's voting structure, the committee needs to think through how much influence investors should have, Blitzer said in an interview on Monday.
MSCI (ex-Morgan Stanley) was (or shall I say is, they seemed to be alight with it until someone raised a stink - wonder why???) a bit less sanguine on the matter:
MSCI (MSCI.N) said on March 2 that Snap would qualify for indexes including the MSCI USA Index, but said on March 3 that after additional analysis Snap did not meet all requirements. Snap's inclusion into the MSCI USA Index will be re-assessed in May, MSCI said in a statement on its website.
MSCI is seeking feedback from investors about whether companies without voting rights should be included in indexes, according to the March 3 statement. A spokesman did not immediately provide further details.
Since no one else will say it, I will. SNAP's lack of earings visibility, slowing growth and void of common shareholder voting rights (at least those shares sold in the IPO) were all easily availalbe. You guys allowed Morgan Stanley and Goldman Sachs to make sheeple of you once again. Now, is not the time to complain. The stock was ridiculously overpriced anway, and may fall further still. Index inclusion requirements vary. For the S&P 500 a stock typically needs a market capitalization of around $5.5 billion and to have been profitable over the past four quarters.
I don't see Snap being profitable four quarters in a row without sacrificing growth, and possible not ieven then.
Click here to subscribe - we give discounts if you spread the word through social media.

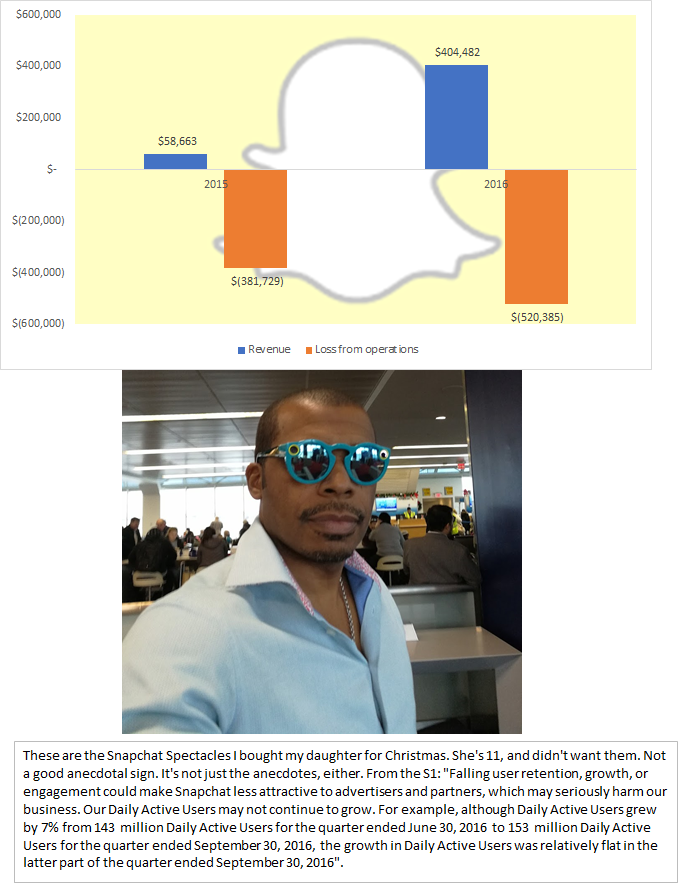
By just the 2nd full day of trading, math and reality hits SNAP stock. Last week, I posted Goldman Sachs & Morgan Stanley Pull Off the Heist of the Decade, Bends Over Those Who Don't Read BoomBustBlog and if that wasn't a textbook example of a guaranteed short, a clear sign of a bubble and the most demonstrable example of the Street taking advantage of clients, then I don't know what is.
Here's livecase video on the topic that I did on Twitter and Facebook last week.

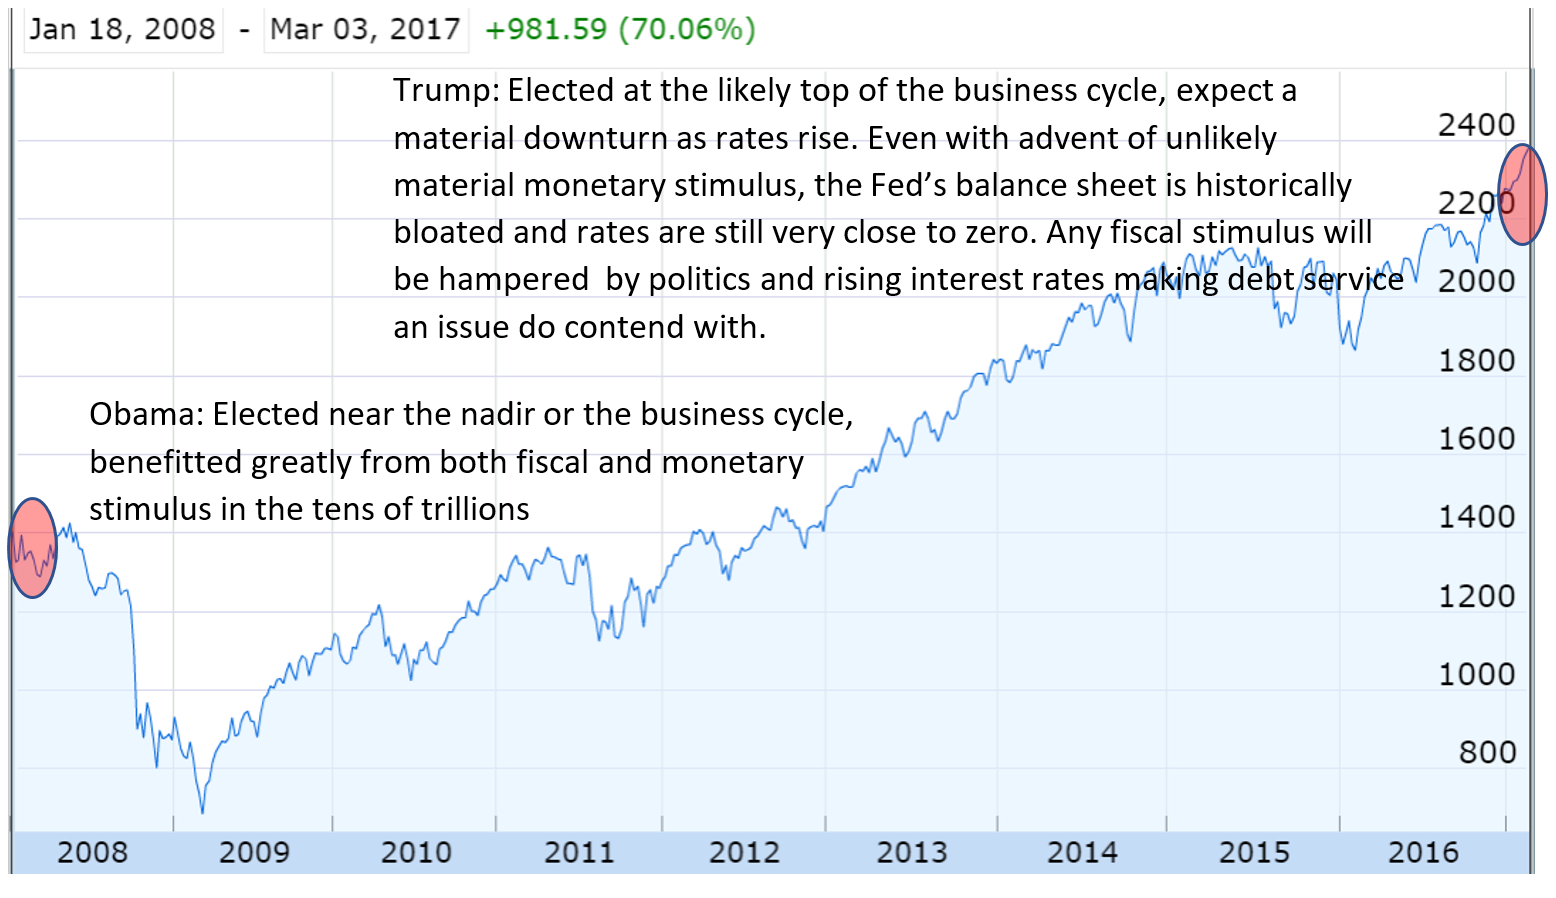
The US stock markets, and the banking sector in particular, have been on a tear since Trump's election. Here's a factual look to determine if all of the capital appreciated hoopla is really worth it.
When I state that Trump has been relatively inefficient in his communication and pursuit of policy, tend to get political and partisan comments in return. Let’s look at Trump’s accomplishments from an empirical perspective, and leave partisan politics to the wayside. In this fashion, we can more accurately gauge the probability of the Trump administration timely accomplishing the tax and stimulus proposals that have (allegedly) driven up (primarily band and financial services) stocks so far, so fast. If it becomes apparent that Trump will not be able to follow through timely, or an existential shock to the system occurs, not only will those rapid gains be rolled back, but a sharper correction or worse is in store.
At the very least, expect to see a changing rate environment.
Keep in mind that both presidents came into office with majority control of the full legislature which makes things easier to get done (relatively).
| Obama | Trump |
| Legislation “Lite”– For Trump, lighter legislation was mostly reversals of the Obama Administration | ||
| Obama won approval of a congressional budget resolution that put Congress on record as dedicated to dealing with major health care reform legislation in 2009 | Block a coal-waste targeting Stream Protection Rule | |
| Requirement for oil companies to disclose payments to foreign governments | ||
| A bill awaits the President’s signature and would repeal a rule that bars individuals deemed mentally incompetent to manage their own Social Security payments from purchasing firearms. | ||
| Major Legislation requiring material fiscal commitment & bipartisan support | ||
| President Obama’s most significant legislative accomplishment in the first month was the signing of the American Recovery and Reinvestment Act. This was close to a trillion dollars stimulus package aimed at arresting and reversing the economic crisis of the Great Recession. It can be argued that this was less a result of Obama’s political statesmanship and more the result of a bipartisan desire to combat the effects of the market crash and economic malaise. While this is likely true, Trump has also ran on the campaign rhetoric that America was invery poor economic shape. While prudent speculators should take this as mere campaign rhetoric, frequent and extreme off-the-cuff comments such as this detracts from general credibility and invokes uncertainty. | Infrastructure overhaul appears (from mediareports) to be encountering partisan politics, being pushed to 2018 to pressure vulnerable Democrats_ | |
| The Children's Health Insurance Reauthorization Act was another early accomplishment scored by Obama that expanded a federally funded medical insurance program to cover roughly four million additional children and pregnant mothers. | ACA (Obamacare) repeal and replace has not shown any material progress – from a public facing perspective, at least. It is likely that this is too massive and complex a piece of legislation to repeal and replace without considerable collateral damage, thus chance are it will be “fixed” instead. While this is, by far, the more logical and practical move – it will result in a distinct failure to follow through on one of the primary Trump campaign promises. | |
| Obama signed the Lilly Ledbetter Fair Pay Act, thus extending the statute of limitations for presenting equal-pay lawsuits – primarily for women. | Plans to materially and dramatically reform the tax code have yet to emerge. There is not a clear consensus on border taxes. | |
| Executive Orders: From Trump’s perspective, pretty much a follow through of what Obama and Bush have implemented | ||
| Obama implemented a new set of ethics guidelines designed to significantly curtail the influence of lobbyists on the executive branch. This apparently broke with actions from the Bush Administration. | Trump issued and executive memo whose “ethics pledge” and “lobbying ban” was essentially drafter from Obama’sorders signed in his early days. | |
| Obama supported the UN declaration on sexual orientation and gender identity | Trump reinstated the Mexico City Policy, blocking federal funds from NGOs that provide access to abortion abroad and nationally. This is not unique policy and is apparently standard operating procedure in the GOP as every republican president in recent history has done so after taking over from a Democrat – including Reagan and both Presidents’ Bush. | |
| Followed through on Bush's Iraq withdrawal of U.S. troops (King: S)econd 100 days will be bigger test for Obama, CNN, John King) | Trump implemented Federal hiring freezes similar to that of Presidents Reagan and Carter – bipartisan. | |
| lifting the 7½-year ban on federal funding for embryonic stem cell research.[8] | Trump’s most notorious executiveorder briefly halted travel from seven Muslim-majority countries. His acting DOJ head (hold over from Obama admin) advised against the order, and when she refused to defend it in court, he fired her. This ended up as a fiasco, as no less than three federal judges stayed the order and hundreds of thousands if not millions protested around the country. Even companies associated with the order (ie. Uber) lost business. Trump is expected to release a new, revamped order this week. | |
| President Obama’s early executive actions sought to mitigate what his administration saw as the overreaches of the Bush anti-terror strategy. One the use of torture in interrogation, insisting that “in all circumstances [prisoners] be treated humanely and shall not be subjected to violence.” Another order called for the closure of the Guantanamo Bay detention facility within a year, an interesting case study in the limitations of a president to achieve policy outcomes by decree. In a departure from what some might have expected, President Obama also ramped up the troop commitment in Afghanistan by 17,000 soldiers in the early days of his presidency. President Obama also repealed the previously mentioned Mexico City Policy. | Trump’s orders to limit migration across the southern border, if followed, could be massive in fiscal scale and policy impact. Estimates of the of a U.S.-Mexico border wall now exceed $20 billion, and additional measures detailed in recent DHS memos (1, 2), including a major increase in immigration enforcement personnel, may cost billions more. While there is a great deal of executive discretion that contributes to the scope and speed of deportation efforts, the text of DHS memos broadly expands the “prioritized deportation” categories to include individuals found guilty of non-violent crimes and misdemeanors. | |
| Obama ordered the closure of the Guantanamo Bay detention camp | Trump has signed additional EOs, although several of them have not yet had a material effect, ie. Moving HSBCs from under the purview of the Dept. of Ed. to directly under the supervision of the White House. | |
| President Obama lifted some travel and money restrictions to the island.[7] | ||
| Obama signed an order requiring the Army Field Manual to be used as guide for terror interrogations, banning torture and other illegal coercive techniques, such as waterboarding.[109] | ||
| Obama signed two Presidential Memoranda concerning energy independence, ordering the Department of Transportation to establish higher fuel efficiency standards before 2011 models are released and allowing states to raise their emissions standards above the national standard.[111] | ||
|
Presidential Approval Rating |
||
| 65% | <40% - It should be noted that this is the lowest approval rating of any early term president since the ratings have been tabulated. | |
 |
||
| Cabinet Appointees & Personnel | ||
| By the end of January 2009, nine out of fifteen of President Obama’s cabinet appointments had been approved by the Senate. |
By the end of January 2017, only three out of fifteen of President Trump’s cabinet appointments had been approved. Trump also had the resignation of National Security Advisor Gen. Michael Flynn and the recusal of his newly minted head of the DOJ for matters related to the Russian interference probes & inquiry. Trump has also fired his head of the DOJ, and is currently facing a direct rebuke by his head of the FBI over allegations that the Obama administration wiretapped Trumps private residence. |
|
In Conclusion
Maintaining an apolitical stance and without opining on actual policy itself – just measuring the effective implementation of policy - It is quite clear from an empirical perspective that Obama has accomplished significantly more in the short period of time following the inauguration than Donald Trump has. To be fair, a portion of this can be explained away by the contextual atmosphere of the times. There was a material political “willingness” to deal with the fallout of the Great Recession. By the same token, those Fiscal Stimulus measures that passed were done so without any GOP support at all. The stimulus package passed in the House of Representatives on January 28 without a single Republican vote. The Republicans developed opposition without developing consensus on an alternative plan.[126]
Another, more unassailable, conclusion is that the priorities of this administration (or at least the energies expended) are more focused on immigration policy than economic, tax, trade and education policy. Now, the constitutional separation of powers prevents the POTUS from acting unilaterally, but nearly all immigration-related policy pledges are in the process of enactment, while there is not material progress shown on fiscal stimulus, tax or economic policy. This should raise a red flag to all of those who feel that the recent stock market runup has any sort of fundamental “legs”.
Even if the POTUS were to switch course and start implementing said policy immediately, the time to actual enactment will be several (if not many) fiscal quarters away, leaving extremely high and unsupported valuation multiples in it’s wake.
Time will further elucidate what this administration’s true policy goals are, but for now it definitely does not seem to be those that support either the campaign rhetoric nor the stock market run-up.
Reasons for Trump’s relative underperformance?
· Trump still does not have a full cabinet, likely due to his selecting very divisive cabinet nominees, inciting unnecessary agita and debate. In addition, many nominees apparently didn’t have proper paperwork in place (relative to Obama’s nominees who had papers in order), at least according to the opposing party.
· Trump has, in my opinion, unnecessarily and to his detriment, started a “war” with the press and even his own intelligence staff and officials. By challenging a machine with significant and aggressive investigative abilities, a large captive audience, and (at least now) an inherent incentive to “catch” the administration in wrongdoing, Trump has (at best) created a very significant distraction that saps the administration’s time, attention and resources - and at worse, forms the machinations of his potential downfall/impeachment. At the end of the day, there was very little reward to be received in declaring a “war” on the press and intelligence agencies (his own, who work directly for him) considering the risks taken.
· Trump is Inexperienced at crafting and implementing policy (literally had zero experience upon inauguration) and it shows
· Either Trump is easily distracted by the media, or he gives the impression of such.
This is has been an attempt to gauge, from a factual and non-partisan perspective, the probability of Trump actually pushing through the policy that has presumably driven share prices so high, so quickly. The short answer from what we’ve seen so far… Nahhh!
See also:

President Obama implemented the Fiduciary Rule, which was supposed to go in effect next month. In short, it says financial advisors and salesmen had to put the interests of their clients ahead of thier own interests. In other words, it outlawed blatantly ripping off your clients. Trump came in and halted this, basically ensuring that it will still be legal to put your bonus pool's interest ahead of you client's interest. Cue in Goldman Sachs and Morgan Stanley. They have pulled off the heist of the decade, essentially selling 200 million digital tokens (they're calling them stocks) with no voting rights at a trailing P/S multiple of 60x and forward multiple of 20x for a startup losing half a billion per year, with said losses increasing over $200M Y-o-Y. This is almost the ultimate in reward free risk
you basically take the risk of a venture capital investor, get the protective covenants of... Oh yeah, there are none, and the reward of... who knows, it's a startup! Oh yeah, you get the returns of venture capitalists as well, right? Wrong! You don't have control or voting powers in the company at all.
At 200 million shares, Snap raised $3.4 billion and was valued at nearly $24 billion as of its pricing. CNBC reported investors were expectinga pricing of $17 to $18 per share, above the $14 to $16 per share range originally given by the company.
The IPO is 12 times oversubscribed. Let me repeat this, 12x oversubscribed. That's how bad... Im sorry, good, Wall Street is at convincing people to want to through their money into the vast unknown. 12 buyers for every share for sale!. ed. Some managers told CNBC they got as little as 2 percent of what they were asking for.
Goldman has done this before (but they've outdone themselves with this Snap thingy), referenceFacebook Registers The WHOLE WORLD! Or At Least They Would Have To In Order To Justify Goldman's Pricing. I was absolutely right then, and math (or common damn sense) dictates I'm right now. The difference is... Facebook was making money, at the fop of its sector and growing like a weed, but still half the valuation of Snap! To be precise, FB generated 7x the revenue of Snap at its IPO and was easily profitable, and had no close competitors - and was still drastically overpriced at IPO. Snap is literally for suckers and sheep. Good luck, fellas! You're gonna need it, particularly as we're at the top of the business cycle (as compared to being at the bottom at Facebook's overpriced IPO.
The macro cycle is not the only thing that should concern those who fell for this deal. Snapchat's growth is slowing already!
| Global | North America (2) | Europe (3) | Rest of World | |||||||||||||||||||||||||||||
| Last Month of Quarter(1) |
DAUs (in millions) |
YOY Growth |
DAUs (in millions) |
YOY Growth |
DAUs (in millions) |
YOY Growth |
DAUs (in millions) |
YOY Growth |
||||||||||||||||||||||||
| Mar’14 | 50 | 415 | % | 27 | 259 | % | 16 | 1,065 | % | 7 | 856 | % | ||||||||||||||||||||
| June’14 | 59 | 173 | 31 | 116 | 19 | 265 | 10 | 319 | ||||||||||||||||||||||||
| Sept’14 | 65 | 126 | 32 | 82 | 21 | 176 | 12 | 258 | ||||||||||||||||||||||||
| Dec’14 | 74 | 92 | 36 | 56 | 24 | 118 | 15 | 214 | ||||||||||||||||||||||||
| Mar’15 | 81 | 62 | 38 | 38 | 27 | 73 | 16 | 134 | ||||||||||||||||||||||||
| June’15 | 89 | 51 | 41 | 33 | 29 | 52 | 20 | 103 | ||||||||||||||||||||||||
| Sept’15 | 99 | 53 | 46 | 42 | 31 | 51 | 22 | 90 | ||||||||||||||||||||||||
| Dec’15 | 110 | 48 | 50 | 39 | 35 | 45 | 26 | 77 | ||||||||||||||||||||||||
| Mar’16 | 130 | 60 | 57 | 50 | 42 | 53 | 32 | 95 | ||||||||||||||||||||||||
| June’16 | 148 | 66 | 63 | 55 | 48 | 65 | 37 | 92 | ||||||||||||||||||||||||
| Sept’16 | 154 | 55 | 66 | 43 | 50 | 59 | 38 | 74 | ||||||||||||||||||||||||
| Dec’16 | 161 | 46 | 69 | 39 | 53 | 51 | 39 | 53 | ||||||||||||||||||||||||
As reported by CNBC, this is the CEOs explanation for said slowdown:
""I think broadly speaking if you look at rest of world growth as a proxy for Android, you can start getting an understanding for the performance issues we face on Android in the last two quarters … [Snapchat] Memories worked very very poorly on low-end devices, largely because of the way we were caching images. The best way to get an actual feel for that is to buy a $100 Android on Amazon and play with the app. That will give you a more qualitative understanding of the issues we face on lower end devices. We've been investing a lot in fixing that and we actually changed the way we develop our products. So in the past our design teams used only iPhones … Now we transitioned half the design team to Android.""
Ok, but that doesn't really justify the slowdown. As a matter of fact, there are plenty of holes in that story. Here's a couple:

Wait, it gets deeper. Later on the CNBC story, others have corroborated what I see as a bogus excuse, to wit:
When contacted for this story, Mark Cuban elaborated on Spiegel's answer in a direct message: "Makes perfect sense. It's an image driven app that can overwhelm lower end devices. But that's fixable."
Another hedge fund investor, who attended the event and requested anonymity due to private nature of the meeting, agreed.
"It's a fair excuse because low end Android development is known and well covered problem given fragmentation and given those devices are less engineered for high quality video," the person said.
Moral to the story, be wary of Mark Cuban and anonymous hedge fund investors backing of "alternative facts" explanations of slowing growth at the top of the business cycle when non-voting shares are sold at what has to be a world record valuation for a start-up company that loses half billion dollars per year, with said losses increasing by roughly $200M per year.
If semi-annual or annual subscribers desire a valuation of SNAP to determine where to go long or short, let me know via tthe BoomBustBlog contact form. Click here to subscribe - we give discounts if you spread the word through social media.


In its press release on January 8, 2008, GGP released the following statement with respect to the financing of its debt liabilities due in 2008 and 2009 -
"The debt maturing in 2008 includes $1.816 billion of mortgage and other secured debt, $722 million of remaining bridge acquisition debt, and $83 million of notes. The Company estimates that property-level income, a measure used by lenders for financing purposes, will be approximately $365 million in the twelve months following the maturity date of the debt maturing in 2008. Using an average capitalization rate of 7.5% to determine loan capacity, the properties would have a value for financing purposes of $4.867 billion. Accordingly, the maturing 2008 mortgage debt of $1.816 billion represents approximately 37.3% of the financing value of the properties.
The debt maturing in 2009 includes $2.744 billion of mortgage and other secured debt and $600 million of notes. The Company estimates that property-level income will be approximately $415 million in the twelve months following the maturity date of the debt maturing in 2009. Using an average capitalization rate of 7.5% to determine loan capacity, the properties would have a value for financing purposes of $5.533 billion. Accordingly, the maturing 2009 mortgage debt of $2.744 billion represents approximately 49.6% of the financing value of the properties"
We analyzed GGP's financial position and its expected funds from operations (FFO) to check the company's ability to meet its debt obligations -
With GGP's optimistic assumptions of a cap rate of 7.5% and NOI of $365 mn and $415 mn for 2008 and 2009, respectively, (based on its historical growth rate of 5%) valuation for GGP's specific properties (on which debt is due for repayment in 2008 and 2009) comes to around $4.9 bn and $5.5 bn for 2008 and 2009, respectively. Based on LTV of 50% (which looks quite reasonable amid the current turbulence in the global credit markets) GGP should be able to raise $2.4 bn and $2.8 bn in 2008 and 2009, respectively. However, GGP's debt due for repayment in 2008 and 2009, respectively, is approximately $2.6 bn and $3.3 bn, translating into respective short-falls of about $188 mn and $577 mn (as shown below), even under the over-optimistic case presented by the company. Surprisingly, the company's financing requirement (as included in its press release) totally ignores the funding requirement for capital improvement and redevelopment programs required for sustained and long-term growth.
| $ million | GGP's Assumptions | Reggie's Assumptions | |||||
| 2008 | 2009 | 2008 | 2009 | ||||
| Property specific NOI | $365 | $415 | $244 | $369 | |||
| Cap Rate | 7.50% | 7.50% | 7.50% | 7.50% | Overly optimistic Cap Rate, but I'l give them this to prove a point |
||
| Value of Properties | $4,867 | $5,533 | $4,589 | $4,919 | |||
| LTV | 50% | 50% | 50% | 50% | |||
| Maximum re-fi available | $2,433 | $2,767 | $2,294 | $2,460 | |||
| Debt due at maturity |
$2,621 | $3,344 | $2,621 | $3,344 | |||
| EMI on prior year financing | $861 | $1,246 | |||||
| Capital Improvements | $542 | $195 | GGP's press release failed to allocate any funds for growth, development, and expansion |
||||
| New Developments | $1,040 | $466 | |||||
| Total Financing Required |
$2,621 | $3,344 | $5,063 | $5,251 | |||
| Shortfall from Re-financing |
$188 | $577 | $2,769 | $2,792 | Even using the extremely optimistic numbers of the press release, GGP falls short of the mark!!! |
||
However, we believe that GGP's assumption of NOI growth of 5% for
2008 and 2009 is unrealistic in view of the softness in the U.S
commercial real estate market, which has already started to experience
the ripple impacts of sub-prime crisis. The (now) highly probable US
recession, along with deteriorating macro-economic conditions, would
make operating environment extremely difficult for commercial real
estate companies like GGP.
Based on our research and detailed analysis of macro economic
factors like retail space demand, household and population growth,
consumer spending, etc we expect rentals to decline 1.0% and 0.9% in
2008 and 2009. If we assume a 1% and 0.9% decline in rentals for 2008
and 2009, and capitalization rate of 7.5% (same as that assumed by the
company), GGP's valuation for these properties comes to approximately
$4.5 bn and $4.9 bn in 2008 and 2009, respectively. This would enable
GGP to avail itself of a re-financing facility of $2.3 bn and $2.5 bn
(based on 50% LTV) against $2.6 bn and $3.3 bn due for maturity,
translating into a shortfall of $0.3 bn and $0.8 bn for 2008 and 2009.
This excludes the financing that GGP would require for capital
improvement and new developments programs. GGP's total funding
requirement, including re-financing, capital improvement and
development plans would be approximately $5.0 bn and $5.2 bn for 2008
and 2009, respectively, which would require additional financing of
$2.8 bn in 2008 and 2009.

I've had this research on MBIA sitting on my desktop for some time now, too busy to convert it into a post for the blog. The macro situation stemming from the real estate bust is unfolding just as I have surmised, albeit a bit quicker and more far reaching than I originally thought. It is scary, for nobody wants to see bad things happen to other people, and I don't want to get caught in a financial downturn regardless of how well prepared I try to make myself. On the other hand, these situations create significant opportunity for gain, primarily from those who refuse to acknowledge the fact that the wave is not only coming, but has reached us quite a while back. I have learned unequivocally what many probably new for some time now. What is that you ask? You really just can't trust government data. Now, I don't want to get into politics and conspiracy theories, but the data as of late has been so far removed from the obvious reality for many that it is almost signaling that the government doesn't even want you to heed the data and is giving you the requisite warning signals. Examples of which are employment data and inflation. Alas, and as usual, I digress, as such is the mind of insane idiot savant that my kids call Dad.
Now, back to the title - What so special about the number 104? It is the number that will probably scare the pants off of anyone who is in equity investors, or potentially anyone who is a customer, of MBIA's insurance and guarantee products. It is the number that when reached, will leave the equity investor with shareholder certificates worth nothing. It is the number where MBIA's equity is wiped clean. Why are you being so damn cryptic Reggie, you ask? Because, I need for you to go through this history of how we came to this point before I explain in detail, so as to get a clear and comprehensive understanding of the situation. That is part of it; the other part is just because I feel like it. Now, let me give you a little cartoon of what the number is, then a background of how we got in this mess to begin with, then an analysis that shows how I got to this number. As usual, you can click on any graph to enlarge it.

And then...

Some time ago I came across this report on the MBIA and ABK by Pershing Square and found it absolutely intriguing. I posted it on this blog on September 3rd, when these companies were trading in the 60's and 70's roughly, and respectively (sometimes it actually pays to read this blog:-). I was actually impressed enough to take a small short position of my own without doing my own forensic analysis. This is something that I regret. Why? Because I am willing to assume significant risk once I convince myself of the strength of a position. Using third party research, I dabble at best - and rarely do I use third party research. So, I dabbled when I should have looked harder and took a significant position. After the fact, I looked further into the industry on an anecdotal basis, then all of a sudden, Bam! The proverbial feces hit the fan blades. The stocks fell so far, so fast, I was taken aback. So, I asked part of my analytical team to take a look at these guys, for I knew that a major problem the monolines, the banks, and the builders all had was a lack of understanding and respect for the rate of decline in value and default of instruments linked to bubble real estate - combined with excessive leverage. So they took a cursory look for me, and they pretty much confirmed my suspicions, but it is not straightforward. There conflicts of interest issues that goes far and wide. So much so, that I will most assuredly not be making anymore friends with this blog. Many of the financial professionals know this, but the layman may not.
What's wrong with the ratings agencies?
What's wrong with the ratings agencies? All of the major rating agencies feel MBIA is in good standing to weather the storm. Coincidentally, they all receive significant fees from the monolines and their customers. Hmmm! Now, there is this song by Kanye West, the rapper. A verse goes, "I'm not saying she's a gold digger…" Well, to make a long story short, any analysis born from compensation received from the entity you are analyzing will always be suspect, at least in my eyes. Conflicts of interest and financially incestuous relationships appear rampant to the paranoid conspiracy type (like me). If you remember my analysis of Ryland, I looked at data as far back as 1993. That gave a succinct, but barely acceptable snapshot of what to expect in turbulent times from a historical perspective. You would need much more data to analyze the more complex topic of MBS. It is believed by the naysayers, that the major ratings agencies have sampled data from only the good times, thus that is why their worst case scenarios still smell like roses. Their predictive prowess over the last few years doesn't look very impressive either. Massive swath of investment grade securities (that they, themselves, labeled investment grade - and were paid by the securities' issuers to do so) are being downgraded straight to junk. I know if I invested in AAA bonds that are losing principal and downgraded to junk in a year or two by the same rating that gave it an investment grade rating in the first place, I would be pissed. But, that is what happens without the proper due diligence, I guess. At least that is what the ratings agencies are bound to say. When looking at data gathered from the real estate boom, and not the busts, you get:
----- EXTENDED BODY:
Data sets limited by favorable recent year trends
Rating agencies assume limited historical correlation (20%-30% for sub-prime) will hold in the future (we've heard this line before) as the credit cycle turns (it is obviously turning now), correlations could approach 100%.
Just imagine if the ratings agencies are as accurate with their opinion of MBIA as they have been with their opinions on the securities that MBIA insures. Look out below!!!
Smaller advisories, coincidentally those that do not receive significant fees from the monolines and their customers, have a different take on the monolines. Take Gimme Credit, for example. Gimme Credit downgraded MBIA's bonds to "deteriorating" from "stable" earlier last week, citing the potential for write downs. They also stated that the other major agencies should have done so a while back. CDS market has also moved against the big monolines. I know everyone has an opinion, but the problem starts to look like a problem when you can prognosticate the opinions based on the incestuous nature of the money trail.
Now, let's be fair to the big agencies
To be fair to the big ratings agencies, they dance a precarious line. If they do downgrade the monolines, they, by default, downgrade all of the bonds and entities that they insure. That is not just mortgages and CDOs, but municipals, hospitals, etc. This ripples through various investment funds, government funds, the whole nine yards. Then again, it really doesn't look good when the companies that don't get fat fees from the insurers and their clients are so much quicker to downgrade than those that do. So they are damned if they do and damned if they don't. Then again, there a fair share of boutique research houses that say that it would take an extremely fat tail and near 100% correlation amongst the insured securities to cause failure in the monolines. Well, have you ever been to Tasmania? Tasmanian devils have very fat tails, as well as a whole host of other animals such as fat tailed skinks and occurrences with a 1 in 2 million chance of happening such as the outlier that took down LTCM. You see, when everyone is leveraged up, and there is one door when someone yells fire - it is going to get awfully crowded around that exit. Call it correlation, call it common sense, call it whatever, but I think we will soon be calling it a foregone conclusion. These fat tails don't have to be as fat as the financial engineers think they have to be. As for the 100% correlation, well that was briefly mentioned in the bullet list above, but from a common sense perspective, as the subprime underwriting really takes effect (what we have seen thus far is just the start), everyone in leveraged instruments (i.e. everyone) will start running for the exits at the same time - hence 100% correlation. I figured this one out without a model, nor a Financial Engineering PhD. I know there are those who disagree with me or may think that I don't know what I am talking about. Well, a few months will reveal one of us to be wrong. Somehow, I don't think it will be me.
Relation between MBIA and Channel Re
Channel Re is a Bermuda-based reinsurance company established to provide 'AAA' rated reinsurance capacity to MBIA. Renaissance Re Holdings Ltd, Partner Reinsurance Co., Ltd, Koch Financial Re Ltd and MBIA Insurance Corp are the investors in Channel Re. MBIA has a 17.4% equity stake in Channel Re and seeded Channel Re with the majority of its business. Channel Re has a preferential relationship with MBIA.
Channel Re has entered into treaty and facultative reinsurance arrangements whereby Channel Re agreed to provide committed reinsurance capacity to MBIA through June 30, 2009, and subject to renewal thereafter. Channel Re assumed an approximate of US$27 bn (par amount) portfolio of in force business from MBIA Inc and has claims paying resources of approximately US$924 mn. (source Renaissance Re 10K. Swapping Paper Losses Channel Re is insulated against huge losses because of adverse selection in terms of pricing and risk on the assumed portfolio of MBIA. The agreement between the Channel Re and MBIA protects channel Re against any major losses. This financial reinsurance scheme smells a little fishy.
Is MBIA dumping mark to market losses on Channel Re through reinsurance contracts?
The SEC and the NYS Insurance Dept. thought so. In addition, there is overlapping risk retained through the relationship - MBIA has an equity investment of 17.4% in Channel Re. Channel Re assumes 52.37% of the total par ceded by MBIA of US$74 bn. The total par ceded not covered through reinsurance contracts due to the equity investment of MBIA in Channel Re is US$6.7 bn. Thus, there is a little under $7 billion dollars of risk that many think MBIA is covered for that it really is not. Then there is the case of diversity of Channel Re's portfolio. I have a slight suspicion that MBIA's business makes up much too much of it to be considered well diversified. Rennaisance Re, the majority owner, has also come clean admitting that Channel Re has a very high exposure to CDO losses and mortgage backed securities. Uh oh! This admission came from the extreme losses Channel Re took last quarter due to mark to market issues for mortgage backed paper. Again, is MBIA doing the old financial reinsurance scheme that was outlawed not too long ago? My gut investor's feeling tells me...For those not familiar with the reinsurance game, here is a primer on financial reinsurance
Haven't we learned how dangerous leverage can be?

Particularly when you don't have a firm grasp on the underlying collateral and risks involved

Do you remember my exclamation of the incestuous relationships? There is the moral hazard issue of everyone getting paid up front except for the ultimate risk holder.

Keep in mind, in terms of terms of the ratings agencies:
They only get paid of the deal closes favorably, and banks go ratings opinion shopping for the desired results - very similar to the residential real estate boom where brokers went shopping amongst appraisers to get the blessed number that they desired. Without that number, the appraiser/ratings agency just won't get paid.
Fairness opinion fees are only really not that synonomous with fairness, since the grand arbiter of fairness is the guy that paid to get the deal done in the first place.
Structured finance (like that of MBIA's business) is 40% of the rating's agencies' revenues and pay out considerably higher margins than the plain vanilla bond business
Reputational risk exists when opinions are changed quickly. They do not want people like me asking why a tranche can go from AA to CCC in a year!!! I think what companies such as Fitch are figuring out is that reputational risk exists in greater part when opinions are changed too slowly and are questioned by pundits publicly in the face of failure. I have noticed that Fitch has gotten much more aggressive than the other two major agencies.
There are several other reasons, which I won't go into here, which are bound to lead one to believe that conflicts of interests are rampant.

So, if I am right, and the insurers are wrong, what happens as default rates increase?


The 7 graphics immediately above are from the Pershing Capital Report linked above.
Monoline insurers make a very unique counterparty. Unlike guidance of traditional ISDA contracts, and unlike traditional insurers, financial guarantors don't put capital up front, they don't post additional capital in the case of contract value decline, and need not post additional capital in the case of an adverse change in their credit rating.
MBIA is woefully undercapitalized in the event of a major mortgage security default event, despite the opinions of the large ratings agencies. Look at the graph and use common sense.

As of Q3 of 07, they had approximately 35 basis points of unallocated reserve to cover net (of reinsurance, see the redundant risk through Channel Re note above) par outstanding financial guaranty contracts. Put in lay terms, MBIA, after buying reinsurance to cover itself for potential losses (some of which it has actually bought from itself), has 35 pennies to pay for every $100 of risk protection that it sells to its customers. This is cutting it thin, no matter which way you look at it. Particularly considering how reliably the subprime underwriting of the recent boom has caused defaults to occur, uniformly and with increasing correlation across multiple and historically disparate underwriting classes. Now, this 35 cents of protection coverage for every $100 of risk translates to extreme leverage. If you think the hedge funds took excessive capital risk due to leverage, you ain't seen nothin' yet.

MBIA easily sports 100x plus leverage for the last quarter or two.
MBIA has increased exposure to Structured Finance during period of rapid innovation and lower lending standards. It's structured finance exposure has increased along with all of the other housing sector related companies during the boom, more than doubling in the last ten years.
MBIA has significant capital at risk

Source: Pershing Capital

Source: Pershing Capital

Source: Pershing Capital
Being so sensitive and exposed to CDOs, one would be curious as to what happens if the CDO spreads widen. Well…
|
Effect of Change in spread in CDO |
||
|
Figures in Million of dollars |
||
|
As of 31/12/2006 |
||
|
CDO Exposure |
130,900 |
|
|
Statutory Capital Base |
6800 |
|
|
Assumed Duration of the CDO bonds |
5 |
|
|
Change in Spread that can eliminate capital |
||
|
In bps |
104 |
|
|
Capital Eroded |
6807 |
|
|
Remaining Equity |
-6.8 |
|
So, an increase of 104 basis points in CDO spreads wipes out the equity of MBIA, TOTALLY wipes it out.
To put this into perspective, let me show you the entire sensitivity grid. Hey, no matter which way you look at, these guys are at risk. They have $6,800 in capital. Just move your finger over any combination of CDO duration and spread in basis points, and if you come close to that 6,800 figure, bingo! The current duration average is approximately 5 years. So the question is, "Will spreads reach 104, or more?" Well, look at the charts above that I posted from Pershing. Better yet, look at the subprime underlyings performance, which can be mimicked by the ABX from markit.com. Horrendous, indeed.
|
Sensitivity Analysis |
||||||
|
Spread in BPS |
||||||
|
Duration |
100 |
102 |
104 |
106 |
108 |
|
|
3 |
3,927 |
4,006 |
4,084 |
4,163 |
4,241 |
|
|
4 |
5,236 |
5,341 |
5,445 |
5,550 |
5,655 |
|
|
5 |
6,545 |
6,676 |
6,807 |
6,938 |
7,069 |
|
|
6 |
7,854 |
8,011 |
8,168 |
8,325 |
8,482 |
|
|
7 |
9,163 |
9,346 |
9,530 |
9,713 |
9,896 |
|
MBIA Valuation
MBIA appears to have engaged in the all so popular share repurchase method of attempting to raise share prices when they don't have anything better to do with shareholder capital. They have authorized and pursued $2.4 billion worth of share repurchases and special dividends. This is unfortunate since one would believe that they need every dime of capital they can get. Did the "program" work? Well, let's see…
|
FY2007 |
FY2008 |
||||||||
|
All Figures in Millions of Dollars, unless othrerwise stated |
Mean Multiple |
High Multiple |
Low Multiple |
Mean Multiple |
High Multiple |
Low Multiple |
|||
|
Tangible Book Value |
6,684 |
6,684 |
6,684 |
7,513 |
7,513 |
7,513 |
|||
|
Diluted number of shares |
128.7 |
128.7 |
128.7 |
123.71 |
123.71 |
123.71 |
|||
|
BVPS |
51.9 |
51.9 |
51.9 |
60.7 |
60.7 |
60.7 |
|||
|
Equity Value Per Share |
$22.7 |
$30.1 |
$16.2 |
$24.5 |
$33.6 |
$17.5 |
|||
|
Current Stock Price |
$35.2 |
$35.2 |
$35.2 |
$35.2 |
$35.2 |
$35.2 |
|||
|
(Discount)/Premium to FMV |
55% |
17% |
117% |
44% |
5% |
101% |
|||
|
Peers |
|||||||||
|
Name |
Ticker |
Mcap |
Price |
BVPS '07 |
BVPS '08 |
P/B '07 |
P/B '08 |
||
|
Ambac Financial Group |
ABK |
4,120 |
26.39 |
65.44 |
74.538 |
0.40 |
0.35 |
||
|
Assured Guaranty |
AGO |
1,570 |
19.8 |
34.33 |
35.804 |
0.58 |
0.55 |
||
|
The PMI Group |
PMI |
1,460 |
13.12 |
42.05 |
43.57 |
0.31 |
0.30 |
||
|
Primus Guaranty |
PRS |
420.8 |
5.83 |
10.05 |
11.26 |
0.58 |
0.52 |
||
|
Security Capital Assurance Ltd |
SCA |
918.34 |
7.06 |
22.647 |
24.44 |
0.31 |
0.29 |
||
|
Average |
0.44 |
0.40 |
|||||||
|
High |
0.58 |
0.55 |
|||||||
|
Low |
0.31 |
0.29 |
|||||||
Book Value includes the effect of derivative and foreign currency loss
So, in a nutshell, despite the significant drop in MBIA's share price, it is still trading at a 55% premium to it's mean adjusted book value comparable price.
MBIA Management Issues
Is it me, or do they have a vacuum of experienced management approaching? Worse yet, did these guys know something that we should be aware of? After all, looking at the graphs below, the industry is going to run into some rought subprime underwriting times!

Subprime Exposure by Vintage Among the Major Monolines

Remember, the Toxic Waste Vintages are '05, '06 and 1st half of '07
Source: S&P
Is Europe next?
A third of MBIA's revenues stem from abroad, primarily in Europe. Most of the action in Europe is in the UK PFI market. These bonds finance roads, schools, rail projects, tunnels and public buildings. Italy, Spain, Portugal and France are also on the bandwagon. Niche sectors such as non-conforming mortgages in the UK (and possible Spain) are particularly susceptible, primarily for the same reasons they are here in the US. Over building, overvalued housing stock (particularly the UK, Spain and Ireland), lax (subprime) financing, and declining property values under loose regulation. It definitely will not help the European insureds if MBIA gets downgraded or CDS spreads widen considerably.

 Ambac Financial Group Inc.
 (Ambac or the Company) was a financial services holding company whose principal subsidiaries, Ambac Assurance Corporation and Ambac Assurance UK Limited, were financial guarantee insurance companies. Ambac Financial Group Inc, headquartered in New York, was founded in 1971.
Realizing the impending crisis in housing and consumer finance in the US, BoomBustBlog (the financial blog primarily authored by Reggie Middleton) pointed out the trouble Ambac Financial Group Inc. had and its potential impact on stock prices in an article (Ambac is Effectively Insolvent & Will See More than $8 Billion of Losses with Just a $2.26 Billion Market Cap), in 2007. According to the article, the possibility of insolvency for Ambac Financial Group Inc. was rising as it was insuring more than it could cover and the quality of its insured products in the subprime mortgage, and consumer finance was deteriorating. The credit rating of Ambac Financial Group was downgraded by rating agency Fitch in January 2008, two months after the article was published as the company dropped its plan of issuing new equity capital after writing down repackaged consumer debt due to subprime mortgage crisis. The financial position of Ambac Financial Group continued to degrade and it eventually filed for bankruptcy in November 2010.
|
Media House |
First article published on |
List of Articles published |
No. of Articles published |
The time lag from BoomBustBlog |
The time difference from Ambac filing for bankruptcy |
Comments |
|
|
BoomBustBlog |
November2007
November2007
November 2007 |
2. Welcome to the World of Dr. FrankenFinance! 3. A Super Scary Halloween Tale of 104 Basis Points Pt I & II, by Reggie Middleton |
3 |
- |
Predicted about 3 years before Ambac's filing for bankruptcy |
Predicted well before filing for bankruptcy |
|
|
Bloomberg |
January 2008 January 2008
November 2010 |
1. Ambac's Agony Deepens 2. Ambac Tumbles on More Subprime Fallout 3. Ambac Financial Group Files Bankruptcy to Restructure Bond Debt |
3 |
2 months (reporting on possible credit rating downgrade) 2 months (reporting on possible credit rating downgrade) About 3 years (reporting on filing for bankruptcy) |
The first report was published before downgrading of credit rating in 2008 by Fitch The second report was published before downgrading of credit rating in 2008 by Fitch The report was published after filing for bankruptcy in 2010 |
Reported before credit rating downgrading and reacted after filing for bankruptcy |
|
|
January 2008
November 2010
November 2010 |
1. Monoline Insurers Sink On Credit-Rating Reviews
2. Ambac Says Chapter 11 a Possibility By Year-End
|
3 |
2 months (reporting on possible credit rating downgrade) About 3 years (reporting before possible bankruptcy) About 3 years (reporting on bankruptcy) |
The first report was published before downgrading of credit rating in 2008. The second report was published some days before the bankruptcy of Ambac reporting concern of the Company on a possible bankruptcy. Report on filing for bankruptcy |
Reacted before the credit rating downgrade Reported before and after the bankruptcy |
||
|
Financial Times |
November 2007 November 2010 |
2 |
No lag (reporting on possible credit rating downgrade) About 3 years (reporting on possible bankruptcy) |
The report was published before downgrading of credit rating in 2008. The second report was published some days before the bankruptcy of Ambac reporting concern of the Company on the prospect of a bankruptcy |
Reported before the credit rating downgrade and also before the bankruptcy filing |
||
|
Forbes |
January 2008 November 2010 |
1. You Should Worry About Ambac
2. Ambac Tumbles Into Chapter 11
|
2 |
2 months (reporting on possible credit rating downgrade) About 3 years (reporting on filing for bankruptcy) |
The first report was published before the credit rating downgrading by Fitch in January 2008 The second report was published after the filing of the bankruptcy |
Reported before the credit downgrading and after the filing for bankruptcy |
|
|
January 2008
June 2010 November 2010 November 2010 |
1. Ambac Loses Top Rating in Blow to Its Business 2. Ambac warns of default as bondholders organize |
4 |
2 months (reporting on credit rating downgrade) About 2 years 7 months (reporting on possible bankruptcy) About 3 years (reporting on possible bankruptcy) About 3 years (reporting on filing for bankruptcy) |
The first report was published after downgrading of credit rating in 2008. The second report was published about five months before the bankruptcy of Ambac reporting concern of the Company on a possible bankruptcy. The third report was published some days before the bankruptcy The fourth report was published after filing for bankruptcy |
Reacted after the credit rating downgrade Reacted in two articles (June 2010 and November 2010) before the bankruptcy on the concern of Company on a possible bankruptcy Also reacted after the bankruptcy |
||
|
November 2010 |
1 |
About 3 years |
It was published after the Company filed for bankruptcy |
Reacted only after filing for bankruptcy |
|||
|
Fortune |
- |
- |
- |
- |
- |
- |
|
|
- |
- |
- |
- |
- |
- |
||
Key Highlights:
Reggie Middleton, through his articles, provided a comprehensive view and some of the earliest warning about a challenging operating environment for Ambac based on its financial status and business profile. His assessment pointed out that, Ambac would be insolvent due to insuring considerably more than the economic value of its equity capital and writing insurance contracts for risky bonds linked to troubled mortgages. Some of the major points highlighted in the article are,
The predictive analysis done by BoomBustBlog was detailed and comprehensive. The prediction made by Reggie and the points highlighted by him were proved right, and in November 2010 the Company filed for bankruptcy.
Bloomberg
Bloomberg reported in January 2008 on downgrading of the credit rating of Ambac Financial Group by Moody’s. In the next article in January 2008, it reported that Ambac was trying to raise capital as it warned of a fourth-quarter loss in FY09.
In November 2010, it reported that Ambac filed for bankruptcy.
Bloomberg pointed out that Ambac faltered after it started chasing higher profits by expanding beyond municipal bond insurance and insuring riskier debt. That move backfired due to the crash in the housing market, and tightening of credit markets.
Bloomberg also reported that Ambac could not raise the needed capital and was unable to reach an agreement with senior bondholders for restructuring.
Reggie had pointed out in his article that Ambac Financial Group Inc. was insuring much more than they can handle in the case of an outlier event given its relatively lower equity capital - and he did this a full three months in advance. It would need to raise an additional USD2 billion to continue as a going concern.
In its first article published in January 2008, the Wall Street Journal (WSJ) reported that Moody's Investors Service and Standard & Poor's signaled fresh consideration of AAA rating bonds of Ambac Financial Group Inc.
In November 2010, WSJ reported that Ambac might file for bankruptcy protection by the end of the year. In the same month, it reported that Ambac filed for Chapter 11 bankruptcy protection after the Internal Revenue Service questioned the accounting that allowed the bond insurer to receive more than USD700 million in tax refunds.
Reuters reported in its article published in January 2008 about the downgrading of credit rating of Ambac by Fitch. Reuters pointed out that the credit rating was downgraded as Ambac dropped its plan to issue new equity after writing down repackaged consumer debt hit by the subprime mortgage crisis.
Reuters published an article in June 2010, stating the concern of Ambac about the prospect of a default on its loan obligations and was still considering filing for bankruptcy. In November 2010, Reuters reported that Ambac filed for bankruptcy. It pointed out insuring risky debt as the primary reason for the bankruptcy of Ambac.
Notably, Reggie Middleton, in his article in BoomBustBlog, has provided a detailed description of the subprime portfolio of Ambac. He pointed out that the subprime RMBS portfolio represented about 16% of the total MBS portfolio of Ambac Financial Group.
Financial Times
In an article published in November 2007, Financial Times reported that Ambac was working on deals to offload risks from parts of its portfolio to ease pressure on its capital base and avoid a downgrade of its credit rating.
In March 2010, Financial Times reported that the insurance unit of Ambac Financial Group was seized by regulators to halt pay-outs on USD35 billion worth of policies covering defaulted mortgage-backed debts. It was done in part to protect the public finance market guarantees from the fallout of the mortgage business. In November 2010, an article was published in Financial Times on the concern of Ambac over a possible bankruptcy. As per Financial Times, default on the risky mortgage due to housing market collapse led to the trouble for Ambac.
Forbes
In an article published in January 2008, Forbes reported on the prospect of credit rating downgrade of Ambac after the company forecasted significantly higher-than-expected losses from insuring credit derivatives, many of them tied to subprime mortgages.
In November 2010, Forbes reported that Ambac Financial Group filed for Chapter 11 bankruptcy, after failing to reach agreements with lenders on how to repay its debt.
In its article published in November 2010, The New York Times reported that Ambac filed for bankruptcy protection after seeking to negotiate a plan with its biggest creditors. In its Chapter 11 petition, Ambac listed several groups of bondholders — all represented by the Bank of New York Mellon as trustee — as its largest creditors, with a total of USD1.6 billion in claims.

Whether you have seen him featured on CNBC, The Keiser Report or are interested in the world of “smart contracts,” Reggie Middleton, the “Disruptor-In-Chief” of Veritaseum, is an expert you should know.
Based in the New York area, Middleton has gone from a successful real estate investor, capitalizing on the market’s economic downturn in 2008, to predicting the fall of Bear Sterns, Lehman Brothers, and others in the years to come. Reggie Middleton has always been a step ahead of the curve, so Bitcoin.com sat down with him on where the banking industry is going with blockchain technology.
As a former banker myself, I’ve seen many parallels with the Internet’s global propagation back in the 1990’s, and how the “banksters” are struggling with the Bitcoin concept, just like they did the Internet way back when. The rhetoric and blind attacks of today show history repeating itself if memory serves me correctly. How does Reggie see this financial industry-wide plan of blockchain integration playing out? Read on.
Bitcoin.com (BC): Haven’t we been through this before with banks trying to co-opt and centralize decentralized systems? Why will this be any different than ISDN or corporate Intranets from the 90’s?
Reggie Middleton (RM): Banks and many other private companies have tried to recreate the virtues of the internet via mini, private internet-like networks called intranets. These intranets were very useful and materially increased the utility of the banks, but they all paled, considerably paled in comparison to the value, utility, and ubiquity of the public internet. Click here for more on how this model works.
BC: You speak to the bankers fairly directly. What is their endgame with private blockchains, which leads to their altcoins? Disrupting the disruptor, Bitcoin? Is the goal to simply becoming more tech savvy and cost-efficient?
RM: Most in the evening industry don’t have an endgame in regards to Bitcoin technology – at least not yet. This is because they don’t fully understand its potential. They appear to be getting most of their education on the topic from a fairly narrow, undiversified set of sources. Hence, any potential misconceptions, biases or downright errors are easily reply ingrained, multiplied and propagated. If this continues for any meaningful amount of time, the re-education can be and likely will be quite painful if not lethal to the less light of foot.
"“Many of the bankers I’ve spoken to eschew Bitcoin and other ‘digital currencies’ […] don’t realize that the private blockchains use altcoins, the very same concept that they are eschewing in Bitcoin and cryptocurrencies.”
For instance, you mentioned altcoins. Many of the bankers I’ve spoken to eschew Bitcoin and other “digital currencies” (failing to realize that most USD and EUR are digital currencies, what they mean is crypto-currencies) don’t realize that the private blockchains use altcoins, the very same concept that they are eschewing in Bitcoin and cryptocurrencies. Worse yet, of all the cryptocurrencies in existence to date, Bitcoin is by far the most vetted. I feel many banks and bankers hear the hype and jump on the bandwagon without doing their due diligence. Time will tell if I’m correct in this assumption.
BC: Do you feel a small-medium sized banks will adopt decentralized digital currencies as a whole? And will this calculated breaking off from the establishment herd drive the industry in a new direction of Bitcoin inclusion?
RM: I think that either a relatively small or underprivileged bank will figure out how this stuff works (“Network effect” and all) and set off a chaotic chain reaction that will tear legacy business models asunder. There’s about a 30% chance of that outcome, in my opinion. The more likely outcome is a technology-oriented concern engineers this tech to disintermediate the banks to the extent that they’ll be rendered mere money pipe utilities needed for their banking charters (say a 60% chance of this outcome). The least likely outcome is the legacy banking industry gets it right, which has never happened before during any major paradigm shift, so leave a 10% chance for this. Click here for more on this.
BC: Do you think banks will make viable blockchains at all? Who says they can model Bitcoin’s success for their private gain?
RM: Banks will make private blockchains whether they will be viable or not is not only up for debate but also highly relative. If what you mean by viable is “Will it work?” Then I’d say yes. Now, if you mean by viable is “Will it be competitive with a widely accepted public blockchain?” then the answer is almost definitely no. You see, “Network effects” prevent private blockchains from ever scaling to the prospective heights of a widely accepted public blockchain such as bitcoin. Click here for more on this.
"‘Network effects’ prevent private blockchains from ever scaling to the prospective heights of a widely accepted public blockchain such as bitcoin.”
BC: Can banks have it both ways? Deriding the bitcoin digital currency while praising its technological foundation? Is this genius, or basic hypocrisy?
RM: Attempting to laud the blockchain while deriding tokens that make them work is neither genius nor hypocrisy. In my opinion, it’s ignorance. Picture me saying, “ I love this Internet thing, but want nothing to do with Internet packets. Unfortunately, only nerds will get that one. For more on this, go here.
BC: Was Jamie Dimon right? Will the government, or some higher power, prevent Bitcoin from going viral in the mainstream, at least in Western civilization?
RM: Jamie Dimon is talking “his book.” He’s talking like a bank CEO, who is expected to say pro-bank things, and slam things that will compete with bank offerings. He’s simply doing his job. Now, please remain cognizant of the fact that this does not mean that he necessarily knows what he’s talking about, nor is he necessarily speaking the truth.
"If bitcoin is outlawed, one risks driving it underground. Governments don’t want tech that they can’t control nor stop driven out of its reach.”
The fact that the US, the world’s most powerful financial concern, has not banned bitcoin should tell you something. If bitcoin is outlawed, one risks driving it underground. Governments don’t want tech that they can’t control nor stop driven out of its reach. That is exactly what will happen if it goes underground as a peer to peer system. Think of how successful the MPAA, the record industry, and the courts have been in stemming the use of peer to peer file sharing of MP3s after their massive legal assault? Hint: over 60% of download Internet traffic is thought to be P2P torrent-style downloads.

The can easily happen to the banking industry. The path of least resistance is to regulate and then attempt to co-opt Bitcoin (think IRS and NSA) then to outlaw and attack outright.
As for his opinion on virality, methinks he may be missing the point? Viral outbreaks are never, never anticipated, wanted nor prevented by those who are subject to it! That’s not a matter of choice!
BC: Please sum up banking, blockchains, and privatization for us. Is this a net-positive for the Bitcoin community just based on the publicity alone?
RM: My summation will likely be different from what you’d expect. I believe that the entire banking community and many of the entities that are serving them are headed in the wrong direction, re Bitcoin technology. Everybody is reaching for the low hanging fruit, totally disregarding why said fruit is hanging low in the first place (hint: it’s fully ripened and is about to drop off the vine). Very wide area networks (vWANs, such as the Internet) were designed to be used by as many entities as possible (not a select group).

This is where the network effect comes into play, and how a publicly accepted Bitcoin network will force banks to play ball in its arena or face extinction. You see, Bitcoin not only enables autonomous activities, but it also rewards them. The legacy banking business model, as we know it today, is predicated on a heteronomous business model. So was the music industry before the Internet. How did that work out for them?
For those that wondered what my stance on Lennar is after raising cash through property sales and tax refunds, here is my update to the Voodoo analysis.
Summary
The worst housing slump in recent history has taken its toll on US home builders, with most of them reporting consecutive quarterly losses in the second half of 2007. Lennar, in particular, reported negative earnings for the fifth consecutive quarter in 4Q2007, witnessing a negative EPS of $6.08 compared with a negative $1.23 in 4Q2006. Its large inventory write-down of approximately $2.4 bn in 2007 along with losses on land sale deal with Morgan Stanley Real Estate significantly impacted its operating performance in 2007. As the US housing woes deepen amid deteriorating US and global economic fundamentals and the economy edges definitively closer to the hard landing that we I have been anticipating I believe that declining consumer confidence and buying power will continue to impact housing demand. This should further depress Lennar's new home prices in 2008 and 2009 and significantly impact its operating and net profit margins..
Key Points
Disappointing 4Q2007 results - Lennar's revenues declined 49.0% to $2.2 bn in 4Q2007 versus $4.3 bn in 4Q2006. Revenues from the homebuilding segment declined 50.5% to $1.9 bn in 4Q2007 from $4.0 bn in 4Q2006, primarily off a 50.4% decline in home deliveries and a 2.1% decline in average sale price. Lennar's new home orders declined 50.4% to 4,761 units in 4Q2007 from 9,606 units in 4Q2006. As Lennar reduced its existing inventory through price incentives, its order backlog declined 65.5% y-o-y to 4,009 units at the end of 4Q2007 with an operating backlog of 64 days. In addition, Lennar also reported a $1.8 bn charge relating to valuation adjustment write-off including $0.17 bn for goodwill write-offs. Overall, Lennar witnessed its highest quarterly loss in 4Q2007, with diluted earnings of a negative $6.08 per share compared to a negative of $1.23 in 4Q2006.
Large inventory impairment and write-down - In 2007, Lennar recorded a huge $2.4 bn charge on account of inventory impairment under FAS144 in 2007 compared with $501.8 mn in 2006 owing to fast declining home prices in its key markets. With the US residential sector not expected to recover over the next couple of years, we believe Lennar would continue to write down its inventory until 2010. We expect Lennar to record $221 mn and $139 mn of inventory impairment in 2008 and 2009, respectively to accurately reflect the market value of its inventories in view of further decline in U.S residential housing prices.
Financial engineering by Lennar - By concluding the deal with Morgan Stanley Real Estate towards the end of FY2007 involving the sale of 11,000 lots for $1.3 bn at a 60% discount, Lennar could claim losses of $775 mn from the transaction and obtain a tax refund of $270 mn (part of overall refund of $852 mn) against taxes paid in successful years of operation (2005 and 2006). Further, the possibility that the two year carry-back period under tax rules could get extended to five years would bail out Lennar from potential liquidity problems to some extent since it could claim refund of taxes from 2002 onwards and resultantly, may not opt for selling its land at current lower prices.
Although the end of 4Q2007 saw Lennar with sizeable cash balances, we believe that the company is still considerably leveraged with debt-to-equity of 74.2% at the end of 4Q2007. At the end of 4Q2007, Lennar had net debt of $2.0 bn as a stand alone entity while as a consolidated entity including JV's recourse debt was $2.5 bn. Moreover, we believe that the cash balance will be eroded by operating losses in the coming years, requiring the company to raise further debt amid conditions of deteriorating housing sector.

I came to this conclusion after a detailed analysis of Ambac's portfolio (at least what Ambac has made public, which was sufficient) covering exposure in the Structured Finance, Sub-prime RMBS and the Consumer Finance business. Ambac's management was forthcoming enough to publish a portion of their insured portfolio which allowed me to review each structure.
I am short Ambac and MBIA (for whom I have also released research), so be aware of my position as I present this opinion. I profit not necessarily from whether ABK can continue as an ongoing concern (which is in doubt and wouldn't hurt my shorts to say the least), nor from an infusion of capital (whether it be debt or equity, either of which would be a poor investment from my perspective) but from the significant decline in value of the existing shares in which I have taken a bearish position. To determine my short position, I calculated relative nominal book valuations, actual economic book valuations and produced standard financial forecasts. Of interest is the loss tail analysis wherein I have estimated the present value of the future losses.
As it stands now, ABK's equity value will be totally wiped out with a 175 basis point move in their insured's underlying - which seems like a very, very likely possibility. My Ambac analysis is much more granular than that of MBIA's (see A Super Scary Halloween Tale of 104 Basis Points Pt I & II, by Reggie Middleton ) where I discussed the predicament of the ratings agencies, the monolines, and in particular, MBIA.
The referenced predicament is exacerbated by the fact that some, such as Ambac, are truly insolvent, thus a mere waiving of the "Magic Ratings Wand" will not pay the claims when they come due. More to the point, the monolines have grown too big for their capital base, specifically their equity base. They are insuring much more than they can handle in the case of an outlier event. I don't consider the burst real estate bubble and the consequent mortgage debacle much of an outlier, for anyone could have seen it coming if they simply opened their eyes.
Now, if a big monoline fails or is even downgraded, a large part of the credit market goes with it. This level of catastrophe may be too much for the powers that be. This portends a bailout of some sort or fashion, or maybe the players will just be forced to take their market medicine. Only the future will tell.
----- EXTENDED BODY:
Bank of America issued a report on the monoline insurers on July 30th, 2007 that states that ABK's RMBS exposure to troubled companies is limited to only 4 cos. with vintages primarily in the early years excluding two relatively well performing underwritings. Despite this, they failed to include in this caveat the consumer finance insureds:
These are the companies and exposure that I am familiar with, at first glance in the consumer finance portion of Ambac's portfolio, without any research. Just imagine if I took a real hard look at the insureds.
Now, using some common damn sense, would you think that the company that is insuring these guys' mortgage and finance products with 90x leverage may be having some problems that they may not be coming forward with. I have over 100 pages of proprietary analysis and calculations costing me weeks of analyst hours, that tell me Ambac may be out of business soon - but I really didn't need to do all of that math and research if I just glanced at the bullet list above. I used the loss statistics from the BofA report as a baseline for the losses in my models on Ambac. I know they are too conservative (and to be fair to BofA, they were contrived before this mess got worse), but that should only lend credibility to my findings. Click here to download ambac loss tail.pdf.
The ACTUAL quality of the ABK's insureds is truly suspect in my opinion and the underwriting quality of their insureds needs to be investigated further. Unfortunately, I have very limited resources. I literally told my team that "this is worth digging in and spending time on, for there are many who are now trying to go long on this stock due to its price and nominal book valuation. If they are wrong, it can be a very profitable opportunity". Well, that's what we did. By investigating the losses on similar books written by the originators for the vintage in question, one can guess the performance of the books underwritten by AMBAC. The policy terms must be examined to see where the breakpoints are for losses, of course. Exposure to Countrywide alone is a cause for suspicion, IMO. As stated earlier, the default estimates in the B of A analysis are assuredly too conservative, but are used for the sake of prudence over alarmism (with some mandatory tweaks to edge them towards reality). Why do I say they are conservative??? Take a look at the REO rates and land value forecasts in my blog, and then look at the target prices for the insurers in question on the first page of B of A's analysis, right before you query the prices of these stocks today. For those that don't have access to the report, I will reveal just this one tiny part:
Bank of America Top Picks (June 2007)
|
Ticker |
Rating |
Price |
Target |
Price as of 11/29/07 |
Profit on the BofA Call |
% Profit |
|
SCA |
B |
$23.60 |
$37.00 |
$6.69 |
($16.91) |
(71.65%) |
|
MBI |
B |
$60.33 |
$85.00 |
$30.04 |
($30.29) |
(50.21%) |
|
Least Favorites |
||||||
|
NONE |
||||||
You really can't get rich listening to these guys. Hopefully, you can see where the use of their default data is a conservative approach (even a bit rosy), albeit tweaked ever so slightly for the sake of reality. As you may have ascertained, I do not put a lot of faith in sell side research. I have even less faith in the big three rating agencies research (although Fitch is trying to be taken seriously). Thus, even if they deem ABK and MBIA not in need of more capital, that is near meaningless in my book. These are the same companies that rated the insured portfolios AAA a year or two ago that are now taking up to 20%+ losses.
We also have to contend with the moral hazard/bailout issue. If you read my earlier missive on MBIA, I detailed the rating agencies' dilemma.
The calculations in this analysis are only estimated losses in 4 insured categories (of many, they are enough to generate significant losses). I am expecting higher losses in Public Finance as well due to the loss of property tax revenues (lower tax base) and income tax revenues led by housing value declines and loss of corporate revenue and jobs, respectively. Many municipalities created huge budgets during bubble times (like everyone else) and failed to prepare for the bubble to burst. Now unfunded services run rampant. The shortfall will have to be covered somewhere, and default on debt service is not out of the question.
In the base case scenario created, we expect the company to report losses to the tune of $8 billion+ in its Structured Finance, Subprime RMBS and the Consumer Finance portfolio. This loss will wipe out the company's remaining equity and it will need to raise an additional $2 billion in order to function as an ongoing concern. Moreover, we think the company will need to reinsure a higher percentage of its portfolio in order to transfer risk and free up capital.
I calculate that Ambac will need to raise an additional $2 billion in order to continue as a going concern. In order to maintain AAA status they will need $5.4 to $7 billion, according to how I perceived the comments of its CEO in the last conference call (they say they are an average of $1.4 billion above what is needed to maintain a AAA status from the three main rating agencies - without my little economic reality marking here). In the base case scenario below, Ambac will need to bolster its reserves by $6.8 billion. A fellow blogger that I follow, Mike Shedlock, commented that Citibank has recently sold approximately 5% of itself to a foreign investor to raise $7.5 billion dollars. Citibank is much more diversified, with a much larger capital base, than Ambac. Let's be realistic here - no let's not - Let's be highly optimistic with pretty rose colored glasses, and say that ABK can fetch a significant premium to Citibank's valuation. ABK's current market valuation is $2.26 billion. Where in the world will they get this kind of capital from and who will be the risk cowboy to give it to them??? These guys are in a real solvency dilemma, and it is a shame that the ratings agencies and the sell side guys have yet to admit it. I guess it takes entrepreneurial investors and bloggers such as me to ferret out the truth, and the truth is hard to find in detail. You remember what Jack Nicholson said in "A Few Good Men"? "The Truth! The Truth! You can't handle the Truth!" I had two analysts and I work on MBIA and ABK for weeks, when I should have been able to just buy a report... Yet, everyone expept Ackman from Pershing Square was unrealistically optimistic. There are some big losses ahead of us folks. If the real estate bust was the impetus for the current debacle, we have a long trip ahead of us because the real estate bust has just started!
My full analysis is bulky, but well documented, and will be posted as a .pdf if I get enough requests. Most should be satisfied with this lengthy summary.
|
Here we have done a loss tail analysis of the forecasted losses of the Structured Finance, Direct RMBS and Consumer Finance portfolio, expecting the losses of the vintage year 2005 to be paid over the next 5 years in 2006-2010. We have calcluated the loss ratio of the company which is deteriorating from 2007 onwards (denoted by Paid losses/Written premium ratio). |
|||||||||||||
|
Base Case Analysis |
Calendar year payout |
||||||||||||
|
Year |
Gross written premium |
Expense ratio |
Total Expected losses |
2003 |
2004 |
2005 |
2006 |
2007 |
2008 |
2009 |
2010 |
2011 |
2012 |
|
2003 |
1,144 |
172 |
972 |
22 |
|||||||||
|
2004 |
1,048 |
157 |
891 |
61 |
|||||||||
|
2005 |
1,096 |
164 |
932 |
200 |
|||||||||
|
2006 |
997 |
150 |
847 |
504 |
|||||||||
|
2007 |
1,006 |
151 |
855 |
1,260 |
|||||||||
|
2008 |
766 |
115 |
651 |
1,928 |
|||||||||
|
2009 |
690 |
103 |
586 |
1,880 |
|||||||||
|
2010 |
635 |
95 |
539 |
1,741 |
|||||||||
|
2011 |
597 |
89 |
507 |
1,437 |
|||||||||
|
2012 |
561 |
84 |
477 |
671 |
|||||||||
|
Calendar year paid losses |
22 |
61 |
200 |
504 |
1,260 |
1,928 |
1,880 |
1,741 |
1,437 |
671 |
|||
|
Cumulative losses |
22 |
83 |
283 |
787 |
2,047 |
3,975 |
5,855 |
7,596 |
9,033 |
9,704 |
|||
|
Report year written premium |
1,144 |
1,048 |
1,096 |
997 |
1,006 |
766 |
690 |
635 |
597 |
561 |
|||
|
Paid Losses/Writtem Premium ratio |
2% |
6% |
18% |
51% |
125% |
252% |
273% |
274% |
241% |
120% |
|||
|
Outstanding loss reserves |
950 |
1,780 |
2,512 |
2,856 |
2,451 |
1,174 |
(120) |
(1,321) |
(2,251) |
(2,446) |
|||
|
Alternatively, we have calculated the provisioning for losses that Ambac will need to make every year on the basis of the anticipated losses that the company will have to pay in coming years. In doing so we have assumed that the 85% of the premium written from 2007 onwards (excluding 15% as underwrting expesnse) will be transferred to the loss expense reserve every year. The loss reserve uptill 2007 is taken from comapny's balance sheet. The losses have been calculated on the basis of various default probabilities assummed in Strucutred Finance, Direct Subprime RMBS and Consumer Finance portfolios. We have assumed a duration of 5 years to spread the losses on various vintages over the coming years. We anticipate the company will have to create a provisoin of $ 6.8 billion under the base case scenario. |
|||||||||||||
|
Base Case Analysis |
Calendar year payout |
||||||||||||
|
Year |
Gross written premium |
Loss and loss expense reserve |
2003 |
2004 |
2005 |
2006 |
2007 |
2008 |
2009 |
2010 |
2011 |
2012 |
|
|
2003 |
1,144 |
189 |
22 |
- |
- |
- |
- |
- |
- |
- |
- |
- |
|
|
2004 |
1,048 |
254 |
- |
61 |
- |
- |
- |
- |
- |
- |
- |
- |
|
|
2005 |
1,096 |
304 |
- |
- |
200 |
- |
- |
- |
- |
- |
- |
- |
|
|
2006 |
997 |
220 |
- |
- |
- |
504 |
- |
- |
- |
- |
- |
- |
|
|
2007 |
1,006 |
279 |
- |
- |
- |
- |
1,260 |
- |
- |
- |
- |
- |
|
|
2008 |
766 |
930 |
- |
- |
- |
- |
- |
1,928 |
- |
- |
- |
- |
|
|
2009 |
690 |
1,517 |
- |
- |
- |
- |
- |
- |
1,880 |
- |
- |
- |
|
|
2010 |
635 |
2,056 |
- |
- |
- |
- |
- |
- |
- |
1,741 |
- |
- |
|
|
2011 |
597 |
2,563 |
- |
- |
- |
- |
- |
- |
- |
- |
1,437 |
- |
|
|
2012 |
561 |
3,040 |
- |
- |
- |
- |
- |
- |
- |
- |
- |
671 |
|
|
Calendar year paid losses |
22 |
61 |
200 |
504 |
1,260 |
1,928 |
1,880 |
1,741 |
1,437 |
671 |
|||
|
Cumulative losses |
22 |
83 |
283 |
787 |
2,047 |
3,975 |
5,855 |
7,596 |
9,033 |
9,704 |
|||
|
Provision for losses |
4 |
(150) |
(588) |
(1,202) |
(1,276) |
(1,294) |
(1,202) |
(930) |
(195) |
||||
|
Total |
(6,832) |
||||||||||||
In our base case analysis of the CDO and the Subprime RMBS portfolio, we have assigned default probabilities based on collateral; wherein we have assumed an average default probability on its subprime collateral of 6% and on its ABS CDO mezzanine a default probability of 25%.
|
Average default probabilities (by Collateral) |
|
|
Subprime RMBS |
6% |
|
Other RMBS |
6% |
|
ABS CDO High Grade |
6% |
|
ABS CDO Mezzanine |
25% |
|
CDO Other |
10% |
|
Other ABS |
10% |
In our base case analysis of the consumer finance business, we have assigned default probabilities largely based on ratings. We assigned a average default probability of 2% on its AAA rating portfolio and 11% average default probability on its BIG (Below Investment Grade) portfolio.
|
Average default probabilities (by Rating) |
|
|
AAA |
2% |
|
AA |
5% |
|
A |
6% |
|
BBB |
8% |
|
BIG |
11% |
In the case of Ambac, and most of my analyses, I draw a distinction between accounting (or nominal) book value and actual economic book value - the stuff I get paid for as an investor. Below you will see comparable valuation based upon nominal book value which actually has ABK underpriced. You will also see the forensically scrubbed economic book value, which in the most optimistic scenario (which I can tell you now, just ain't gonna happen) has Ambac valued at about $9 per share. You don't want to know what the base case and pessimistic scenario portend.
|
Ambac Financial Corp |
||||||||
|
Relative Valuation |
||||||||
|
Nominal Book Value |
FY2007 |
|||||||
|
All Figures in Millions of Dollars, unless othrerwise stated |
Mean Multiple |
High Multiple |
Low Multiple |
|||||
|
BVPS |
53.67 |
53.67 |
53.67 |
|||||
|
Equity Value Per Share |
$22.5 |
$34.4 |
$12.7 |
|||||
|
Current Stock Price |
$21.8 |
$21.8 |
$21.8 |
|||||
|
(Discount)/Premium to Fair Market Value |
(3.11%) |
(36.60%) |
70.93% |
|||||
|
Book value as marked to market (Optimistic Scenario) |
||||||||
|
FY2007 |
||||||||
|
All Figures in Millions of Dollars, unless othrerwise stated |
Mean Multiple |
High Multiple |
Low Multiple |
|||||
|
BVPS |
21.4 |
21.4 |
21.4 |
|||||
|
Equity Value Per Share |
$8.97 |
$13.71 |
$5.09 |
|||||
|
Current Stock Price |
$21.8 |
$21.8 |
$21.8 |
|||||
|
(Discount)/Premium to FMV |
142.89% |
58.93% |
328.49% |
|||||
|
Book value as marked to market (Base Case Scenario) |
||||||||
|
FY2007 |
||||||||
|
All Figures in Millions of Dollars, unless othrerwise stated |
Mean Multiple |
High Multiple |
Low Multiple |
|||||
|
BVPS |
-14.0 |
-14.0 |
-14.0 |
|||||
|
Equity Value Per Share |
($5.87) |
($8.98) |
($3.33) |
|||||
|
Current Stock Price |
$21.8 |
$21.8 |
$21.8 |
|||||
|
(Discount)/Premium to FMV |
(470.93%) |
(342.71%) |
(754.38%) |
|||||
|
Peers |
||||||||
|
Name |
Ticker |
P/B '07 |
Price |
BVPS '07 |
||||
|
MBIA Financial |
MBI |
0.38 |
22.3 |
58.5 |
||||
|
Assured Guaranty |
AGO |
0.64 |
20.17 |
|||||
|
The PMI Group |
PMI |
0.25 |
10.45 |
42.43 |
||||
|
Primus Guaranty |
PRS |
0.59 |
5.91 |
|||||
|
Security Capital Assurance Ltd |
SCA |
0.24 |
5.32 |
|||||
Price to Book Value
|
Average |
0.42 |
|
|
High |
0.64 |
|
|
Low |
0.24 |
|
An Increase in spread of 175 Bps would erode the entire equity |
||
Here you see Ambac has significant exposure to some of the worst vintage years, and as detailed above has some of the worst possible clients one would want ensure. These ingredients mix to become a very toxic cocktail, indeed.
|
AMBAC |
||
|
Total subprime exposure with in insured portfolio |
||
|
Total MBS portfolio |
53.9 |
|
|
RMBS subprime exposure |
8.8 |
|
|
% of total RMBS portfolio |
16.3% |
|
|
Sub prime porfolio by vintage |
||
|
vintage 1998-2001 |
1.2 |
13.6% |
|
vintage 2002 |
1.2 |
13.6% |
|
vintage 2003 |
2.4 |
27.3% |
|
vintage 2004 |
0.8 |
9.1% |
|
vintage 2005 |
1.6 |
18.2% |
|
vintage 2006 |
1 |
11.4% |
|
vintage 2007 |
0.6 |
6.8% |
|
Direct Subprime RMBS |
8.8 |
100.0% |
|
36.4% of the subprime portfolio belongs to vintage years of 2006-2007 when credit writing standards has been on its low. |
||
|
Total CDO portfolio (in US$bn) |
||
|
High yield |
24.3 |
34.0% |
|
Investment grade |
8.6 |
12.0% |
|
ABS > 25% MBS |
29.2 |
40.8% |
|
ABS < 25% MBS |
3 |
4.2% |
|
Other |
2.80 |
3.9% |
|
Market value CDOs |
3.60 |
5.0% |
|
71.5 |
100.0% |
|
|
Breakdown of CDO of ABS's subprime collateral by rating |
2Q 07 |
3Q 07 |
|
AAA |
3.8% |
7.4% |
|
AA |
39.7% |
39.0% |
|
A |
47.2% |
36.9% |
|
BBB |
8.6% |
8.7% |
|
Below investment grade |
0.7% |
8.0% |
|
Sensitivity Analysis - Default probabilities - Base case |
||||||||||||
|
Vintage |
Sub-prime RMBS |
Other RMBS |
ABS CDO High grade |
ABS CDO Mezzanine |
CDO other |
Other ABS |
||||||
|
1998 |
2% |
Average defualt probabilities (by Collateral) |
||||||||||
|
1999 |
2% |
Subprime RMBS |
6% |
|||||||||
|
2000 |
2% |
Other RMBS |
6% |
|||||||||
|
2001 |
2% |
ABS CDO High Grade |
6% |
|||||||||
|
2002 |
5% |
ABS CDO Mezzanine |
25% |
|||||||||
|
2003 |
5% |
CDO Other |
10% |
|||||||||
|
2004 |
8% |
5% |
5% |
15% |
10% |
10% |
Other ABS |
10% |
||||
|
2005 |
8% |
5% |
5% |
15% |
10% |
10% |
||||||
|
2006 |
15% |
8% |
8% |
35% |
10% |
10% |
||||||
|
2007 |
15% |
8% |
8% |
35% |
10% |
10% |
||||||
|
Sensitivity Analysis - Deafulat probabilities - Worst case |
||||||||||||
|
Vintage |
Sub-prime RMBS |
Other RMBS |
ABS CDO High grade |
ABS CDO Mezzanine |
CDO other |
Other ABS |
||||||
|
1998 |
5% |
|||||||||||
|
1999 |
5% |
|||||||||||
|
2000 |
5% |
|||||||||||
|
2001 |
5% |
|||||||||||
|
2002 |
10% |
|||||||||||
|
2003 |
10% |
|||||||||||
|
2004 |
20% |
10% |
10% |
30% |
15% |
15% |
||||||
|
2005 |
20% |
10% |
10% |
30% |
15% |
15% |
||||||
|
2006 |
30% |
15% |
15% |
70% |
15% |
15% |
||||||
|
2007 |
30% |
15% |
15% |
70% |
15% |
15% |
||||||
Reggie Middleton is an entrepreneurial investor who guides a small team of independent analysts, engineers & developers to usher in the era of peer-to-peer capital markets.
1-212-300-5600
reggie@veritaseum.com


